
A series mining the PhD thesis “London and UK Office Buildings: Investigating Energy Use and Landlord-Tenant Influences” (Azhari, 2025).
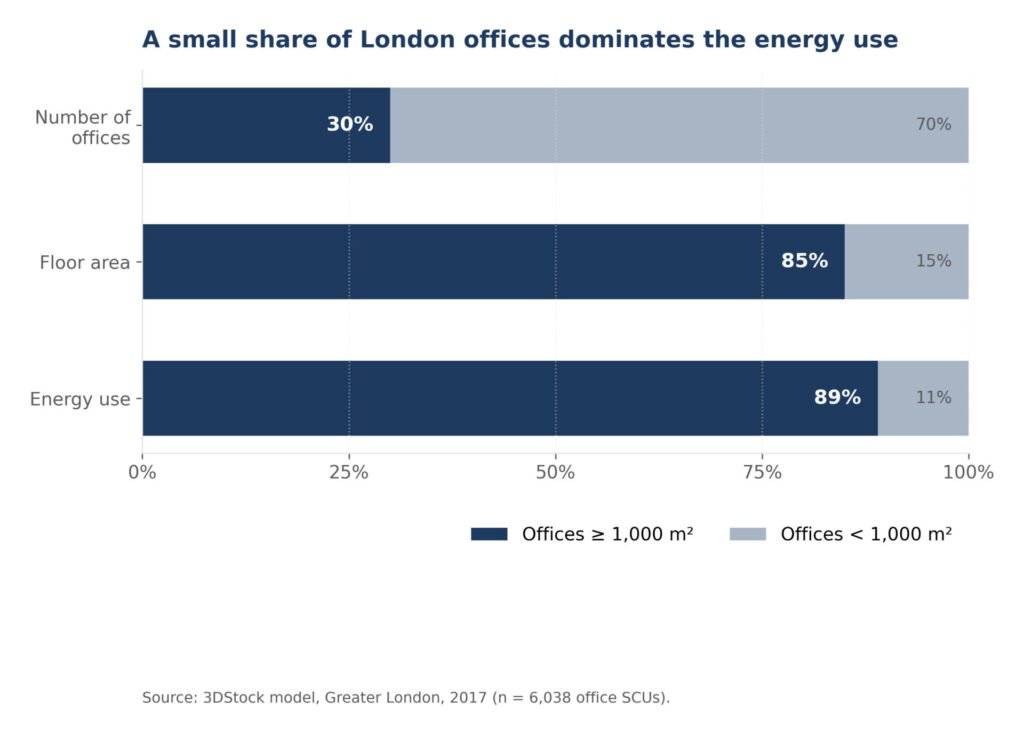
Key takeaway. Thirty per cent of London office buildings above 1,000 square metres hold 85 per cent of the office floor area and consume 89 per cent of the office energy. The concentration is so extreme that almost everything that follows in policy, retrofit and benchmarking has to start there.
The headline you cannot un-see
If you analyse 6,038 commercial office buildings in Greater London with metered electricity and gas data for 2017, a single ratio crystallises out of the noise. Offices larger than 1,000 square metres account for 30 per cent of the count, 85 per cent of the floor area and 89 per cent of the energy use. Push further into the data and the concentration deepens. Within that large-office segment, high-rise buildings (six storeys and above) constructed after 1980 account for around 64 per cent of energy use. Four London boroughs (the City of London, Westminster, Camden and Islington) account for roughly two thirds of office floor area and energy use across the whole of Greater London.
To borrow a phrase from epidemiology, the office sector has a long tail with a heavy head. A small number of large, recent, high-rise buildings dominates the demand profile so completely that almost any policy, retrofit programme or benchmark refresh that does not address them first is fighting the wrong fight.
Where the figure comes from
The 30/85/89 result is not an estimate. It is a stock-level count built on the 3DStock empirical model, which stitches together the Ordnance Survey Address Base Premium, OS Master Map building footprints, Environment Agency LiDAR data for height, Land Registry INSPIRE polygons, the Valuation Office Agency Non-Domestic Rating List and summary valuation data, GIM International UK Buildings construction-date layer and BEIS electricity and gas meter data. The model produces a Self-Contained Unit (SCU) for every physically and administratively bounded office in the city, which sidesteps the messy reality that many offices cross multiple premises, footprints and meters. Article 4 unpacks the 3DStock methodology in more detail; for now, treat an SCU as the energy boundary around what most people would call one office.
The 1,000 square metre threshold is not arbitrary. It is the cut-off the UK government considered in its 2021 consultation on a performance-based rating framework for non-domestic buildings, which makes the ratio policy-relevant rather than merely descriptive. It is also the size band at which the diversity of office activity (multi-tenant, mixed-use, plant-rich) becomes the rule rather than the exception.
The 2026 National Buildings Database (DESNZ), which the author contributed to, extends the 3DStock approach to all of Great Britain and reports 163,131 office SCUs nationally with 114.97 million square metres of office floorspace. The concentration pattern observed in the Greater London 2017 sample holds at national scale. London alone holds 23 per cent of office premises and 23 per cent of floorspace, but 29 per cent of national office energy demand. The thesis 30/85/89 ratio is not a London quirk; it is the local signature of a pattern that runs through the whole country.
Why the concentration matters for policy
Concentration this extreme has three immediate implications for the way the UK regulates office energy.
First, it argues for size-based thresholds. The 1,000 square metre threshold for an operational rating scheme picks up almost nine in ten kilowatt-hours of office energy while leaving smaller premises untouched. A blanket threshold that covered every office and every premise would multiply administrative cost while addressing a small share of the demand. A higher threshold of say 5,000 square metres would miss meaningful chunks of the multi-tenant mid-market.
Second, it changes the conversation about enforcement. Regulating thousands of small premises is primarily a compliance and inspection problem. Regulating a few thousand large premises is closer to a stakeholder-engagement problem. The two require different government capabilities and different industry partners. Australia NABERS scheme, the most-cited international exemplar, has succeeded in part because it built deep relationships with the relatively small number of major commercial landlords who own most of the large stock.
Third, the concentration raises a regulator dilemma that is not yet resolved in the UK: do you regulate buildings or organisations? Premises ownership is even more concentrated than premises size. Owners of offices larger than 1,000 square metres control roughly half of the total office floor area but represent only about four per cent of all office owners. Regulating the buildings is technically tidier. Regulating the organisations who own them is operationally far more efficient. The two need not be alternatives, but the choice of frame matters.
What it means for owners and asset managers
For practitioners, the 30/85/89 figure should set the order of operations on a retrofit plan. The marginal kilowatt-hour is much easier to find in a single high-rise, post-1980, City of London tower than across a handful of mid-terrace, low-rise, secondary assets outside central London. That is not a counsel of despair for secondary stock. It is a counsel of triage.
A useful rule of thumb is to ask, for every pound of capital expenditure, which buildings in the portfolio sit in the heavy head and which sit in the long tail. A portfolio more than two thirds in the head should concentrate effort on operations, controls and plant in those buildings before touching fabric in the tail. A portfolio mostly in the tail will have a different rhythm and probably a longer payback profile, but the levers (LEDs, controls tuning, sub-metering, asset replacement at end of life) are largely the same.
The figure also has implications for benchmarking. If your large-office assets sit around the median of the empirical distribution from the Greater London stock, you are running a fairly typical building. If they sit above it, the concentration of energy use means even modest percentage improvements in those assets will dwarf large percentage improvements in smaller assets elsewhere.
What the data does not see
Concentration figures of this kind are powerful precisely because they collapse a complicated landscape into a memorable number. They are also limited in ways every reader should hold in mind. The 30/85/89 ratio is a 2017 single-year cross-section. Demolition, refurbishment, the gradual upgrading of the rating list and shifts in tenancy mix will have moved the underlying counts since. The dataset does not capture operating hours, plant efficiency, building fabric quality, occupant density, BMS set-points or hours of use, so the ratio describes where the energy is, not why it is there.
The threshold itself is empirical rather than regulatory, and at 500 square metres or 2,000 square metres the story changes in degree. Finally, this is a Greater London picture, and although London is the largest single office market in England and Wales (around 30 per cent of office floor area), it is not a clean proxy for the rest of the country.
None of these limitations diminish the headline. They sharpen what to do with it. If the energy of the office sector is concentrated, then so is the leverage. The next two articles in the series take the leverage problem apart: first by examining what physical characteristics of these large buildings actually predict energy use (the answer, briefly, is “not as much as you would think”), and then by showing how the building-level story gives way to an organisational story about leases, service charges and management practice.
Limitations
The figures are based on Greater London office SCUs in 2017, a single-year snapshot. Demolition, refurbishment and shifts in the rating list since may have moved the headline ratios. The 1,000 square metre size threshold is empirical, not regulatory. Different cut-offs (500 or 2,000 square metres) shift the concentration story. Energy meter data could not be matched to every SCU. Buildings without metered data are excluded from the energy share calculations, which may bias the numerator. The Greater London office stock is not representative of all UK office stock; extrapolation caveats are covered in Article 11.
References
Evans, S., Liddiard, R., and Steadman, P. (2017). 3DStock: a new kind of three-dimensional model of the building stock of England and Wales. Environment and Planning B. Available at: https://journals.sagepub.com/doi/full/10.1177/0265813516652898
Steadman, P., Evans, S., Liddiard, R., Godoy-Shimizu, D., Ruyssevelt, P., and Humphrey, D. (2020). Building stock energy modelling in the UK: the 3DStock method and the London Building Stock Model. Buildings and Cities. Available at: https://doi.org/10.5334/bc.52
Liddiard, R., Godoy-Shimizu, D., Ruyssevelt, P., Steadman, P., Evans, S., Humphrey, D., and Azhari, R. (2021). Energy use intensities in London houses. Buildings and Cities, 2(1), 336. Available at: https://doi.org/10.5334/bc.79
Bruhns, H. (2008). Identifying determinants of energy use in the UK non-domestic stock.
Valuation Office Agency (2012). Non-Domestic Rating List statistics for England and Wales. Available at: https://www.gov.uk/government/collections/non-domestic-rating
BEIS (2021). Performance-based policy framework for rating the energy and carbon performance of commercial and industrial buildings above 1,000 m2 in England and Wales. Available at: https://www.gov.uk/government/consultations/performance-based-policy-framework-in-large-commercial-and-industrial-buildings
Evans, S., Fennell, P., Humphrey, D., Liddiard, R., Oraiopoulos, A., Palmer, J., Ruyssevelt, P., Shamsi, H., Amrith, S., and Steadman, P. (2026). National Buildings Database Phase 2. Department for Energy Security and Net Zero. Available at: https://www.gov.uk/government/publications/national-buildings-database-phase-2-understanding-great-britains-buildings
Read next
Article 4: Mapping the Stock. Inside the 3DStock Model and Why Buildings Resist Easy Counting.
Article 3: Eighteen Per Cent. What Building Characteristics Can and Cannot Explain About Office Energy Use.
About this series
This article is part of a fifteen-piece series adapting the 2025 PhD thesis “London and UK Office Buildings: Investigating Energy Use and Landlord-Tenant Influences” (Azhari, 2025) for a mixed academic and industry readership. The empirical findings draw on the 3DStock model of 6,038 office Self-Contained Units in Greater London with metered energy data for 2017, supplied by BEIS under a data-sharing agreement, alongside the Better Buildings Partnership Real Estate Environmental Benchmark. The qualitative findings draw on semi-structured interviews with seven major UK property organisations, conducted during the 2021 lockdown. Interviewees and their organisations are anonymised by role and organisation type. Please cite the original thesis for academic use.
Author. Rayan Azhari completed his PhD at the UCL Bartlett School of Environment, Energy and Resources in 2025, supervised by Paul Ruyssevelt and Kathryn Janda. The research was supported by the EPSRC Centre for Doctoral Training in Energy Demand (LoLo) and UK Research and Innovation through the Centre for Research into Energy Demand Solutions.
Other articles in the series. Article 1 The 30/85/89 Problem; Article 2 Why EPCs Do Not Tell You How Much Energy a Building Uses; Article 3 Eighteen Per Cent; Article 4 Mapping the Stock; Article 5 Height, Age and the Fuel Question; Article 6 The Split-Incentive Problem; Article 7 Green Leases and Service Charges; Article 8 From 38 to 73 Per Cent Energy Savings; Article 9 NABERS for Britain; Article 10 Time to Retire ECG-19; Article 11 Can London Speak for England and Wales; Article 12 The Hybrid-Work Footprint; Article 13 Why I Used Linear Regression Over Random Forest; Article 14 Vertical Postcodes; Article 15 What Is a Building?